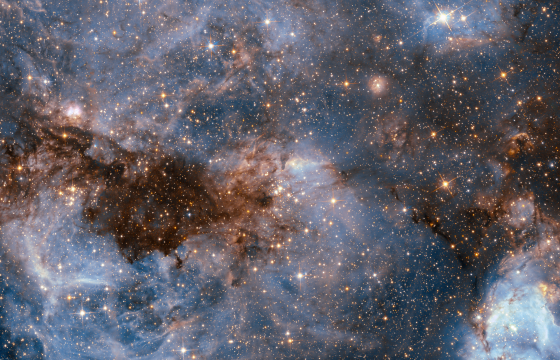
Scientists communicate with images. We want to know not simply one value, but how each value compares with other values measured in other situations: other times, other samples, other planets. Picturing our data as spots on a grid is worth a thousand numbers. At our recent meeting of the Meteoritical Society in Berlin, every paper relied on images with specks of many colours (each colour also a different shape, for the colour-blind) representing different sets of data.
No number is perfect; no single measurement is perfect. We repeat each measurement tens, hundreds, thousands of times. If you were to plot each measurement you’d get a cloud of dots and hope that the truth is somewhere within that cloud. The better your precision, the tighter your cloud, the better you can guess where the truth may lie.
Instead of plotting all the thousands of individual measurements, though, it’s usually sufficient to mark on the diagram one spot that represents the average value of all the points. Through that spot you can then draw a cross of lines embracing the area that would have been covered by the whole cloud. We call these lines error bars.
15 September 2016, The Tablet
Joining the dots: bearing witness to the celestial tapestry
Get Instant Access
Continue Reading
Register for free to read this article in full
Subscribe for unlimited access
From just £30 quarterly
Complete access to all Tablet website content including all premium content.
The full weekly edition in print and digital including our 179 years archive.
PDF version to view on iPad, iPhone or computer.
Already a subscriber? Login


